Key Takeaways"Even if Hormuz is open, ships won't move" — The real problem is not a physical blockade of the strait, but the "economic closure" driven by insurance, profitability, and safety. It is premature to be reassured by news of "resumed transit."
"Don't treat this as a one-off" — Suez, the Red Sea, and now Hormuz. Chokepoint crises recur — only the location changes. What is needed is not a "Hormuz-specific plan" but an organisational design that works for any crisis.
"It was organisational silos, not supply disruption, that amplified the damage" — Companies where insurance, procurement, logistics, and finance operated in isolation suffered the greatest cost overruns. Victory in a crisis is determined by whether cross-functional mechanisms have been built during peacetime.
Table of Contents
- What Happened — A Review of Events from Late February 2026
- Impact on Japan — A "Four-Channel Simultaneous Transmission" Beyond Energy Alone
- This Is Not Just About Hormuz — The Universal Structure of Chokepoint Crises
- What Companies Must Do — Cross-Functional Responses That Determine Crisis Costs
- Scientific Risk Management — The Cone of Uncertainty and Scenario Design
- Conclusion — Designing the Organisation for "the Next Crisis" Starts Now
1. What Happened — A Review of Events from Late February 2026
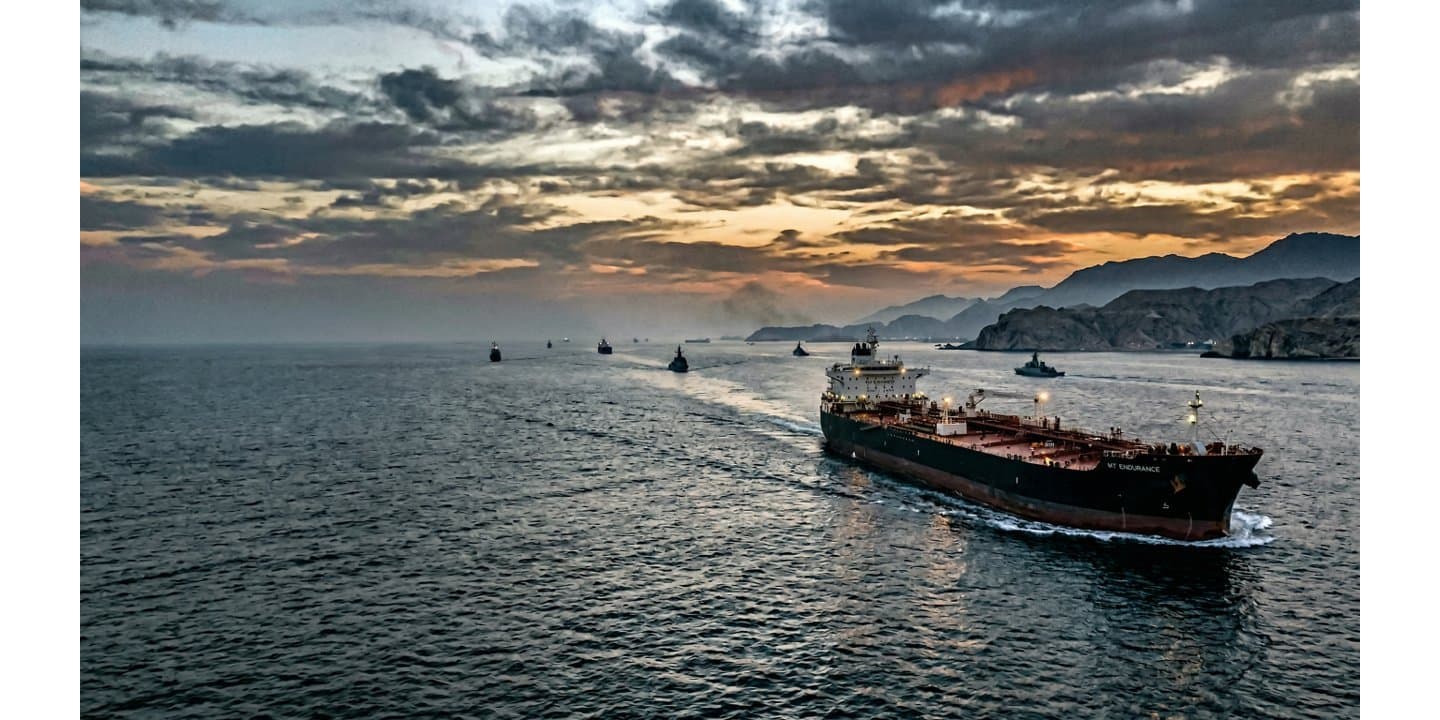
Following the U.S.-Israeli strikes on Iran in late February 2026, transit conditions in the Strait of Hormuz — through which more than a quarter of the world's oil trade passes — changed dramatically. Debating the definition of "blockade or not" is meaningless. The moment shipping companies halted transit and insurance effectively ceased to function, commercial flows reached a state of "de facto closure."
Figure 1. Timeline of the 2026 Hormuz Crisis
| Period (2026) | Event |
|---|---|
| February 28 | The U.S. and Israel struck Iran. Iran declared a "blockade" of the Strait of Hormuz, and Japan's three major shipping lines immediately suspended transit. |
| Early March | Lloyd's expanded its war-risk designated zones, causing insurance premiums to surge approximately 12-fold relative to vessel value. Tanker rates also spiked to $420,000/day, and major carriers simultaneously introduced three types of emergency surcharges. |
| Mid-March | The IEA (International Energy Agency) and Japan's Ministry of Economy, Trade and Industry (METI) supported supply through strategic reserve releases and obligation reductions, while the petrochemical industry began domestic capacity adjustments. The IMO initiated discussions on a maritime corridor, but more than 45 Japan-related vessels remained stranded in the Gulf. |
| Late March | METI decided to release approximately 8.5 million kiloliters from the national strategic petroleum reserve, confirming a total of 238 days of reserves. Japanese buyers accepted a sharp rise in aluminum premiums, while UNCTAD (United Nations Conference on Trade and Development) issued an international warning on energy and fertilizer supply risks due to the sharp decline in transit. |
| End of March | Iran suggested it might allow transit of "non-hostile" vessels, but the actual improvement in insurance and safety conditions remained uncertain. Private-sector responses began, including Chubb offering coverage capacity, but the situation remained fluid. |
The core of this crisis is the simultaneous occurrence of "physical disruption" and "economic disruption." Even if the strait is physically open, ships will not move unless insurance, safety, and profitability conditions are met. It is dangerous to be complacent based on reports of "resumed transit."
2. Impact on Japan — A "Four-Channel Simultaneous Transmission" Beyond Energy Alone
Framing this crisis solely as an "oil shock" captures only half the picture. The impact on Japan propagated simultaneously through four channels: energy, maritime transport, non-energy materials, and policy intervention.
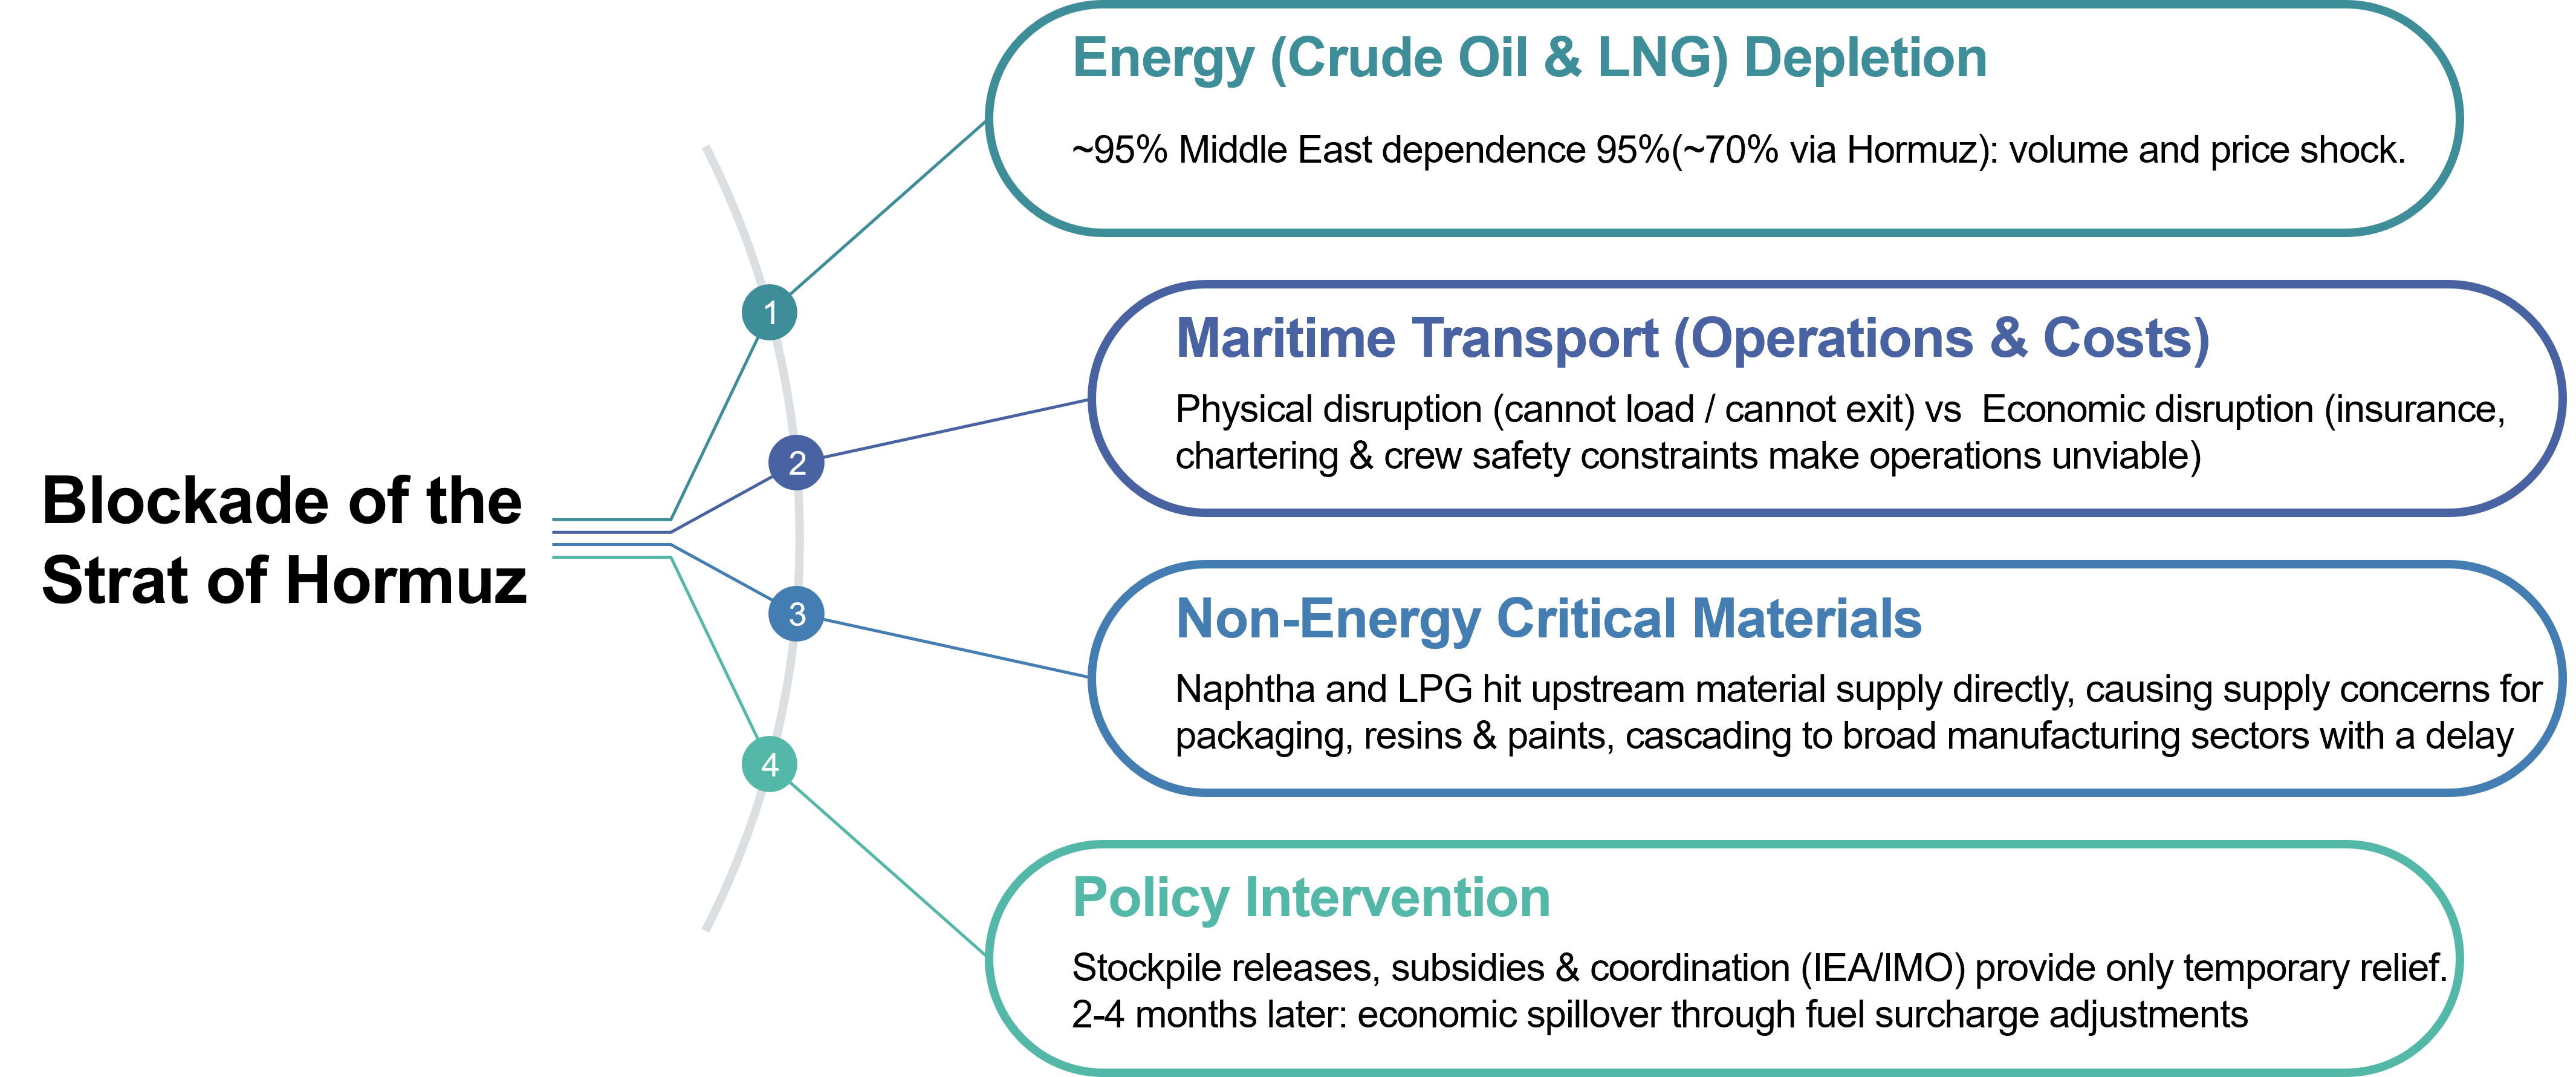
Figure 2. Impact on Japan — The Chain of Transmission
These are not independent problems — they are interconnected. Rising insurance costs drive up transportation costs, which in turn push up landed costs for materials, propagating through the cost structures of manufacturing and food industries in a cascading chain.
2.1 Energy — What 238 Days of Reserves Reveal and Conceal
According to estimates by the Agency for Natural Resources and Energy as of the end of March 2026, total reserves across national, private, and joint-producer categories amounted to 238 days (national: 146 days + private: 86 days + producer-country joint: 6 days). The government reduced the private reserve obligation from 70 to 55 days and decided to release approximately 8.5 million kiloliters from the national reserve. Combined with the IEA's coordinated release (400 million barrels), "volume security" has been achieved to a certain extent for the time being.
However, "securing volume" and "making transport operationally viable" are two different things. Releasing reserves only buys time if there is no prospect of resuming imports. Due to the fuel cost adjustment mechanism, electricity and gas tariffs carry a time lag of two to four months. Even though crude oil prices are surging now, the full cost pass-through to households and businesses will come several months later.
2.2 Maritime Transport — "Surcharges, Not Base Freight, Are the Real Battleground"
The global container freight benchmark (Drewry WCI) showed limited increases as of March 2026. However, this does not capture the reality. The true "battleground" is not the base freight rate but surcharges. Three types of surcharges — Emergency Bunker Surcharge (Maersk example: USD 200/TEU), Emergency Conflict Surcharge (CMA CGM example: USD 2,000/TEU), and War Risk Surcharge (Hapag-Lloyd example: USD 1,500/TEU) — have been layered on top of each other on short notice.
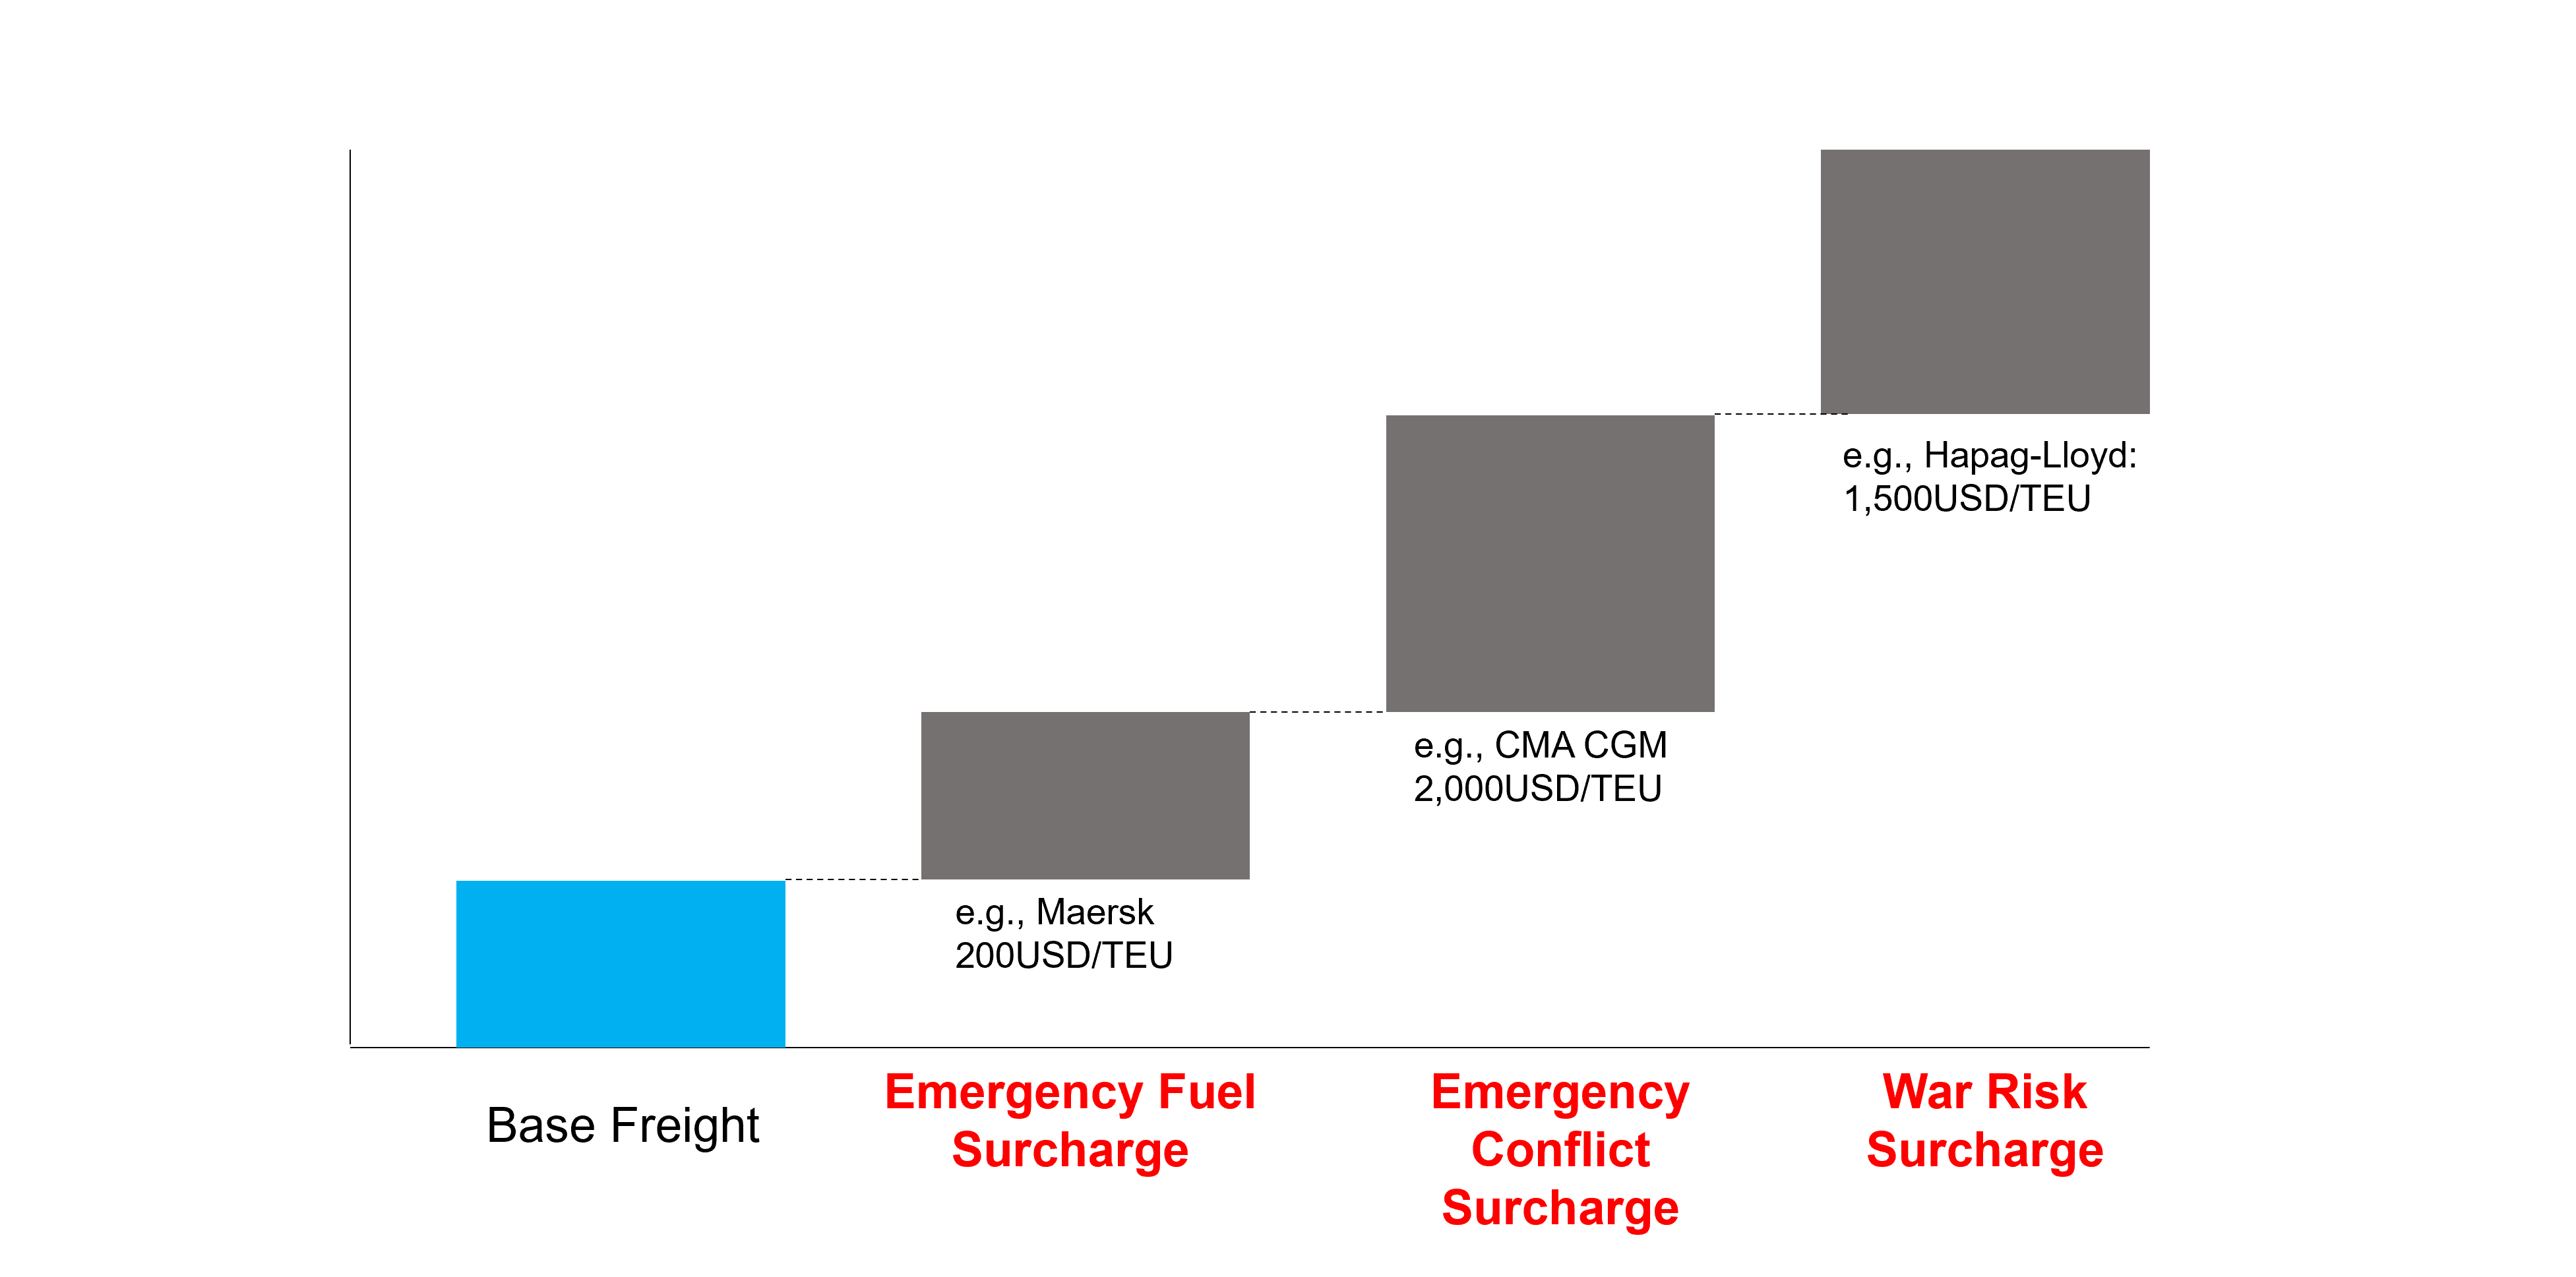
Figure 3. Surging Surcharges
Furthermore, BIMCO's War Risks clauses grant carriers the right to refuse or reroute through dangerous waters. The assumption that "you can get your cargo shipped if you pay enough" has collapsed.
2.3 Non-Energy Materials — The Hidden "Main Event" Three to Four Months Out
As disclosed by the Japan Petrochemical Industry Association, dependence on Middle Eastern naphtha stands at approximately 40%. The downstream ripple effects — from ethylene to resins to packaging materials and components — extend across a broad range of manufacturing industries. Inventory buffers of approximately 3.5 to 4 months mean that many companies perceive "no problem for now," but this is precisely the most dangerous posture. Middle Eastern urea export prices have surged significantly, generating indirect cost impacts across agriculture, food processing, and food service. Aluminum supply uncertainty has driven up premiums, with reports of Japanese buyers being compelled to accept.
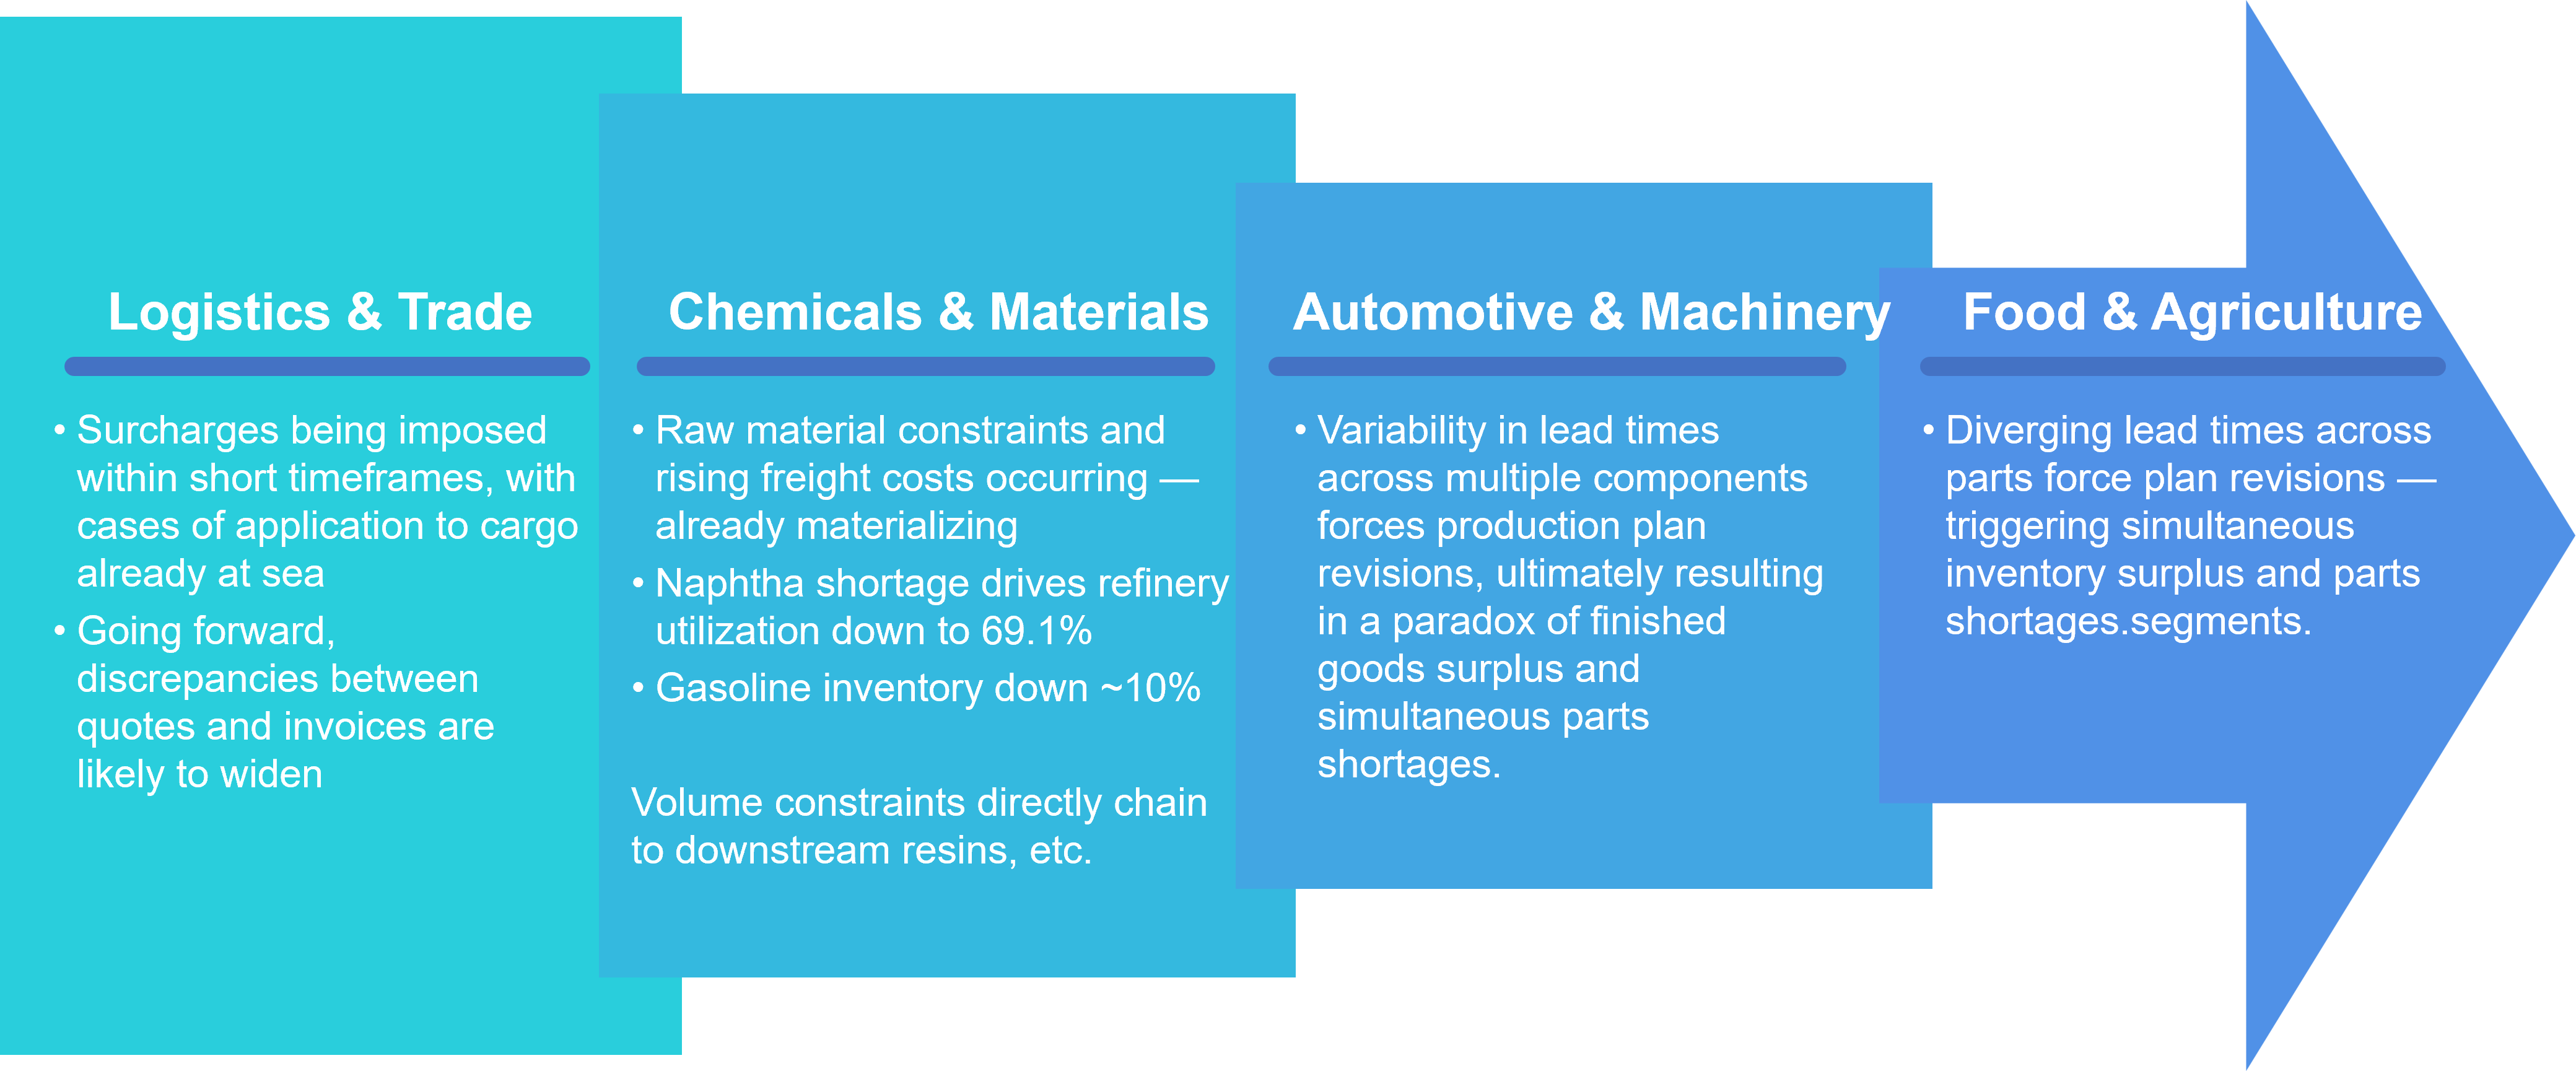
Figure 4. Cross-Industry Chain Reaction
2.4 Government Response: "Volume Security" and "Framework Development" Have Advanced
METI promptly implemented reductions in private reserve obligations and released national reserves. The Ministry of Land, Infrastructure, Transport and Tourism (MLIT) proposed and championed a safe transit framework (maritime corridor) for the Strait of Hormuz at the IMO Council. The Ministry of Foreign Affairs coordinated with the UK, France, Germany, Italy, and the Netherlands, and a joint leaders' statement welcomed the IEA coordinated release. These government actions deserve recognition.
However, government responses have structural limitations. Reserves are finite, and "securing volume" is merely a measure to buy time. The "economic disruption" dimension — insurance conditions and crew safety — cannot be resolved through government frameworks alone. The operational implementation of the maritime corridor under discussion at the IMO will still require considerable time.
3. This Is Not Just About Hormuz — The Universal Structure of Chokepoint Crises
It would be a mistake to frame the lessons of this crisis as "Hormuz-specific measures." The Arabian Sea in 2019, the Suez grounding in 2021, the Red Sea Houthi attacks of 2023–24, and now Hormuz — chokepoint crises have recurred, only changing in location. The structure is the same every time, and Japanese companies have amplified costs through the same siloed responses each time. The question to ask is not "How do we prepare for Hormuz?" but "How do we design an organisation that can respond to any chokepoint crisis?"
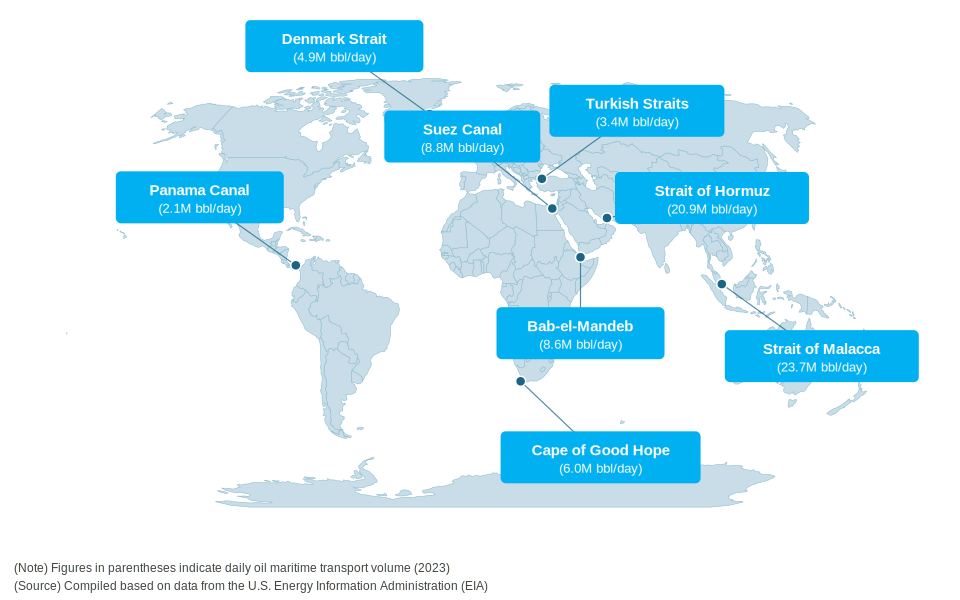
Figure 5. Major Global Chokepoints (Source: Economist Online)
4. What Companies Must Do — Cross-Functional Responses That Determine Crisis Costs
4.1 The Harm Caused by Misaligned Decision Criteria and Information Silos Across Departments
Much of the damage companies suffered in this crisis was not caused by "supply being cut off" but by "inter-departmental silos creating delays in response and amplifying costs."
Figure 6. Typical Damage Patterns from Inter-Departmental Silos
| Silo Pattern | Departments Involved | Typical Damage |
|---|---|---|
| Missed insurance notifications | Legal x Logistics | Failure to comply with war risk insurance notification obligations resulted in claim denials. Companies bore the full cost of in-transit losses. |
| Delayed surcharge pass-through | Management x Sales | Surcharges introduced on short notice could not be passed through to customers, leaving the company to absorb costs amounting to tens of millions of yen. |
| MOQ violations and penalties | Procurement x Legal | Securing spot alternative procurement caused volumes to fall below long-term contract minimum order quantities, triggering penalties. |
| CCC deterioration and cash flow strain | Logistics x Finance | Increased inventory and advance payments drained cash, but management could not grasp the situation until the monthly close. |
| Production planning and procurement out of sync | Manufacturing x Procurement | The specifications and delivery dates of alternative materials arranged by procurement did not align with production schedules, materialising line-stoppage risks. |
-
MOQ (Minimum Order Quantity): The minimum number of units a supplier requires per order.
-
CCC (Cash Conversion Cycle): A financial metric expressed in days that measures the time between paying for materials and collecting revenue from sales, indicating cash flow efficiency.
The common structure behind all of these is that "the department that knows," "the department that can act," and "the department that can decide" exist in isolation. The solution is not to abolish silos. It is to design in peacetime "what information must be synchronised, with whom, and at what timing during a crisis" — what the author calls "cross-functional interface design."
Specifically, the starting point is to manage the following three elements as a "shared cross-functional ledger" maintained at a single version across management, legal, logistics, and procurement.
4.3 What Companies Must Do
The highest-priority action item is "designing for uninterrupted transport and procurement." This requires establishing shared visibility and agreed-upon thresholds for critical items' inventory cover days, ETA variability, unconfirmed bookings, port congestion volumes, and alternative supply reliability.
Figure 7. Top Priorities in an Era of Global Supply Chain Uncertainty
| Management | Legal | Logistics | Procurement |
|---|---|---|---|
| Set threshold values for inventory cover days of critical items | Review applicability of force majeure clauses | Visualise inbound ETA variability and unconfirmed bookings | Secure spot capacity with alternative suppliers |
| Pre-define cost tolerance limits and decision-makers for threshold breaches | Verify war risk insurance coverage conditions, notification obligations, and exclusions | Standardise surcharge pass-through rules | Secure cash-out capacity for advance payment requirements |
4.4 Shift the Corporate Mindset to Option Value
Once short-term bleeding has been stanched, companies need to fundamentally rethink their supply chain design philosophy. If one accepts the premise that chokepoint crises will recur, then a paradigm shift from a "peacetime-optimised" model — where Just-in-Time and cost minimisation reign supreme — to an "option-value-oriented" model that prioritises uninterrupted cash generation is inevitable.
Figure 8. The Supply Chain Design Paradigm Shift
| Dimension | Before (Peacetime Optimisation) | After (Option Value Orientation) |
|---|---|---|
| Design Philosophy | Just-in-Time and cost minimisation | Quantify "where a break will halt our cash generation" and ensure fault tolerance |
| Network | Pursuit of scale economies through single-chokepoint dependence | Build redundant multi-corridor networks for risk diversification |
| KPIs | Landed logistics cost per unit | Total profitability of inventory placement and logistics incorporating financial impact (CCC, etc.) |
| Inventory Policy | Inventory is cost. Reduction is good. | Raw material inventory that sustains non-stoppable operations is "insurance" — exempt from cost-cutting |
5. Scientific Risk Management — The Cone of Uncertainty and Scenario Design
5.1 From "Single-Point Forecasts" to "Scenario Portfolios"
Companies that bet on a single-point forecast — "this will be resolved in three months" — only to see the crisis persist for six months and their plans collapse: this pattern has repeated itself in every past crisis. The effective approach is to embed the concept of the "Cone of Uncertainty" into corporate management (Schoemaker, Day & Snyder, 2013). Rather than relying on a single forecast, this thinking framework recognises the possibility space in which multiple scenarios may diverge, and maintains options against each scenario.
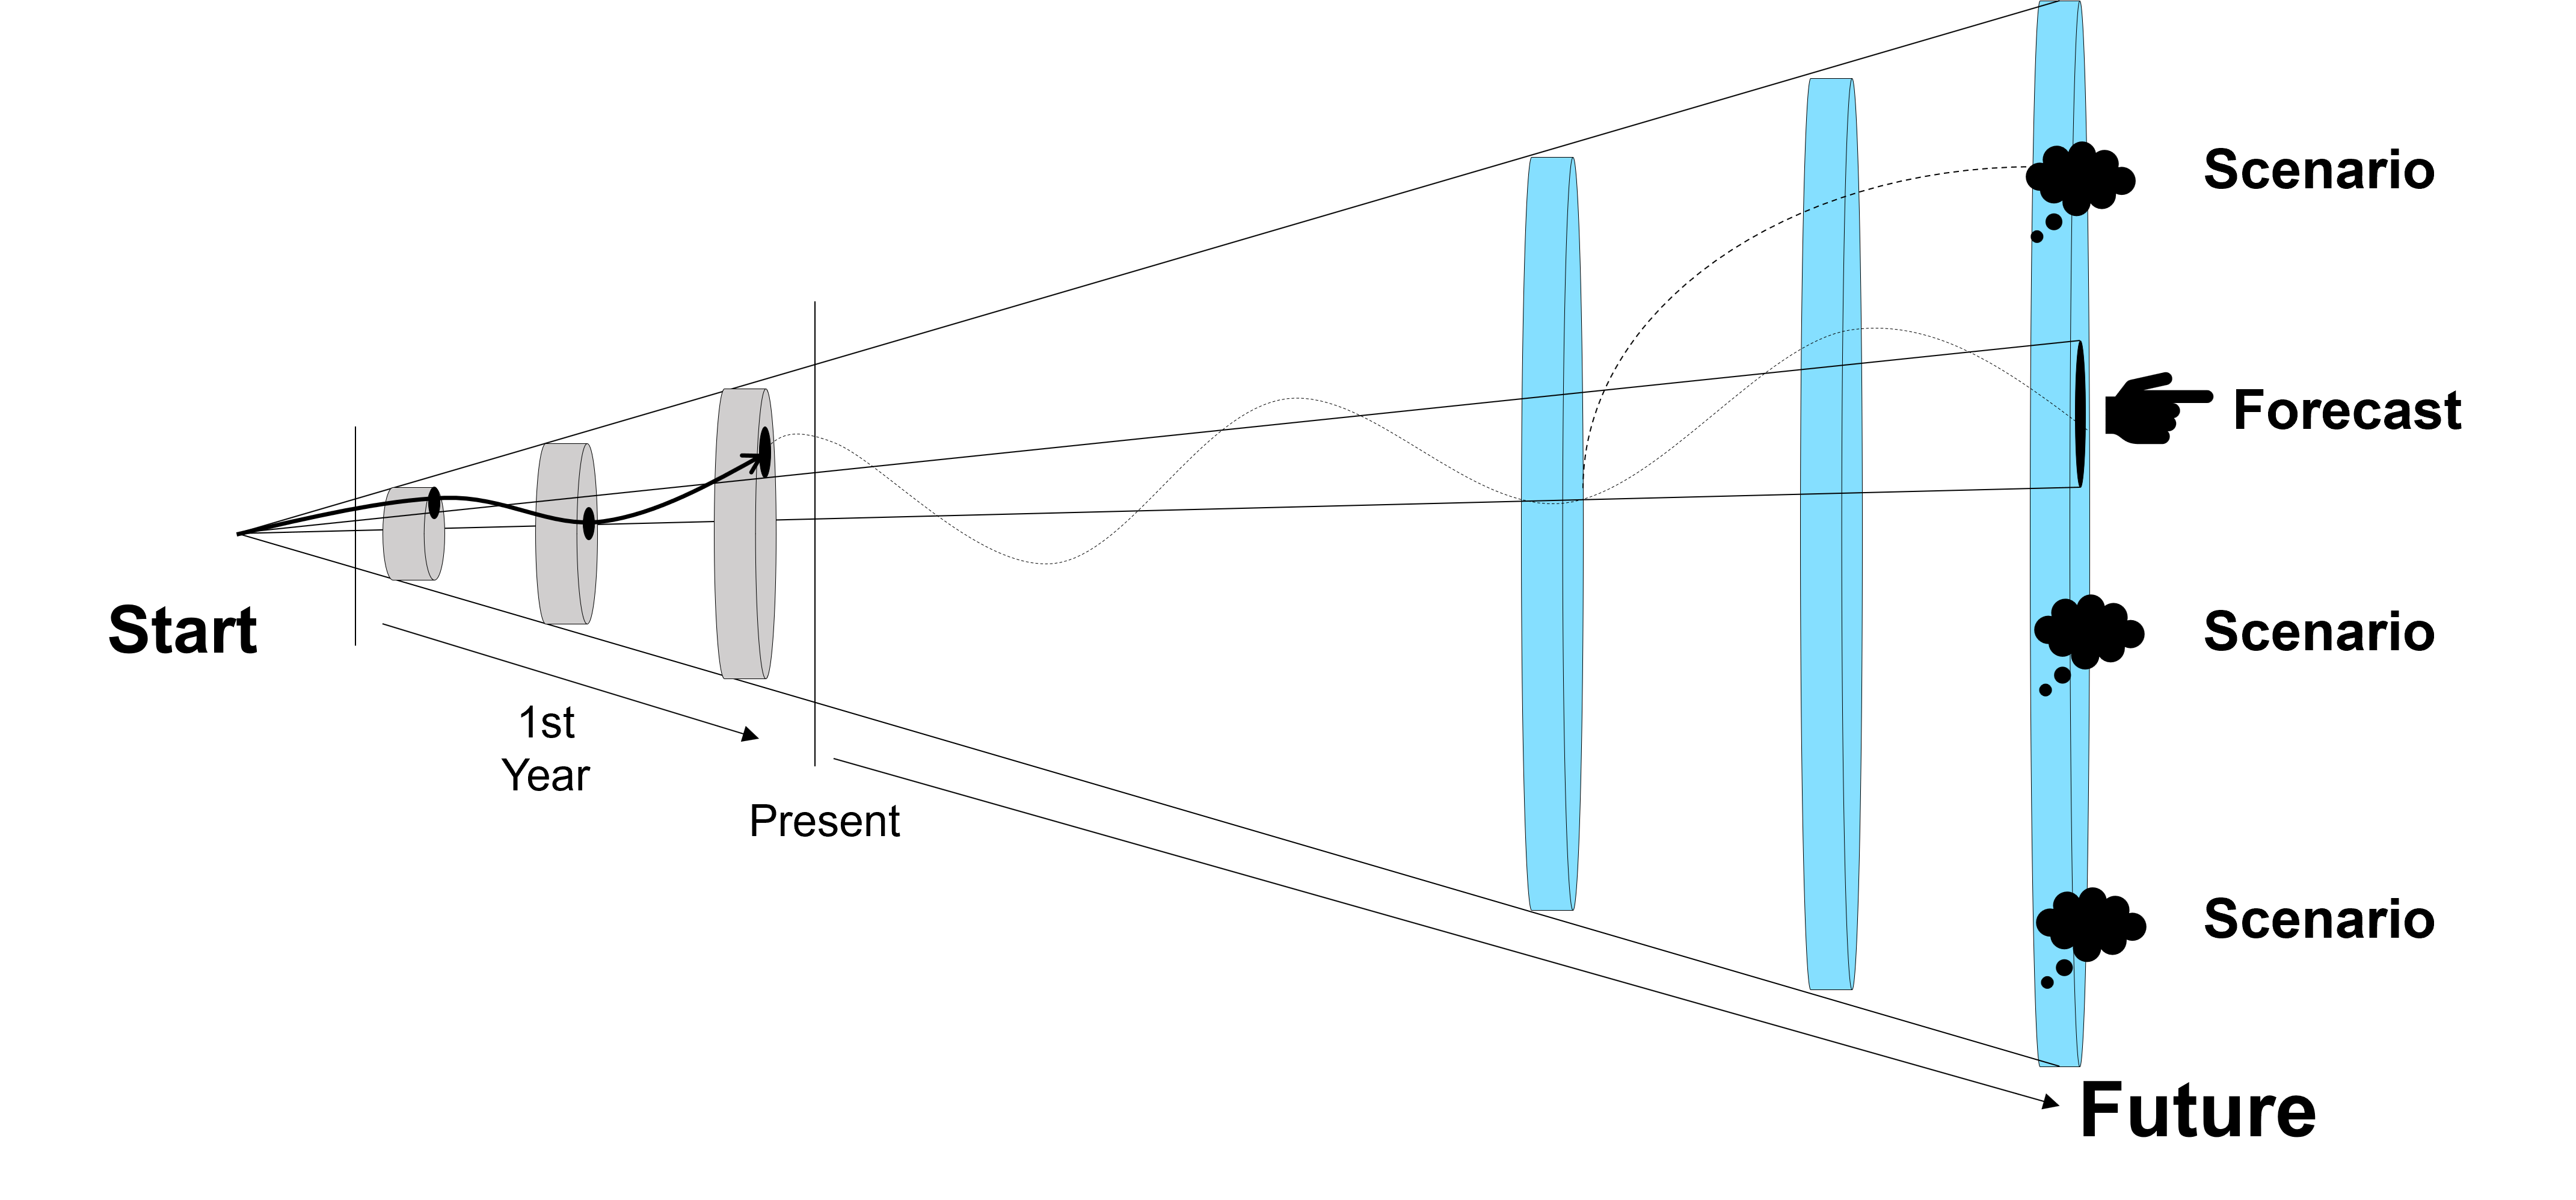
Figure 9. The Cone of Uncertainty
5.2 Three Scenarios and Pre-Designed Decision Rules
The key to scenario design is not "accuracy" but "pre-defining who can decide what, up to what cost, and without consulting whom, when each scenario materialises." By using "conditions under which logistics become operationally viable (insurance, safety, profitability)" as triggers rather than "battlefield predictions," organisations can manage the time gap between a political "ceasefire agreement" and an operational "logistics resumption."
Figure 10. Three-Scenario Design for Chokepoint Crises
| Scenario | Description / Conditions | Impact on Companies | Priority Response |
|---|---|---|---|
| S1 Early Partial Resumption | Maritime corridors, escorts, and insurance support function, enabling gradual resumption of transit. Political ceasefire ≠ operational resumption. | Insurance premiums and charter rates remain elevated. Risk of misreading "resumption = return to normalcy." | Prioritise cost pass-through and contract term finalisation |
| S2 Sustained High Costs | Transit resumes only partially and high costs persist. Oxford Economics and others assess this as probable. | Increased inventory, advance payments, and expanded credit lines strain CCC. Financial deterioration — not logistics costs — hits management hardest. | Scenario-specific funding plans and procurement portfolio redesign |
| S3 Prolonged Supply Constraints | Transit remains operationally non-viable for an extended period, and supply constraints materialise beyond the buffer provided by reserve releases. | Companies without pre-defined answers to "what to stop and what to keep running" face simultaneous overpaying and production cuts. | BCP activation, pre-determined production priority rankings, and accelerated alternative material qualification |
6. Conclusion — Designing the Organisation for "the Next Crisis" Starts Now
This article began with the facts of the Hormuz crisis that erupted in late February 2026, tracing the impact on Japan, Japan's response, and the limits of that response. The situation will continue to evolve beyond the time of writing (end of March 2026). But it is precisely for this reason that this article positions its arguments not as "prescriptions that change with the situation" but as "organisational design principles that can be applied to any chokepoint crisis."
First conclusion: The essence of chokepoint crises is that they recur — only the location changes. Even when Hormuz calms down, the next crisis could be Suez, Malacca, or Bab el-Mandeb. The window for preparation opens only in the intervals between crises.
Second conclusion: The outcome of crisis response is determined by cross-functional organisational design. Maintaining insurance ledgers, force majeure determination workflows, and surcharge pass-through rules during peacetime — and building mechanisms that enable management, legal, logistics, and procurement to operate in sync across two layers of "short-term: stanch the bleeding" and "long-term: structural transformation" — is the only shortcut to minimising costs.
Third conclusion: Embed scientific scenario design as a standing agenda item in management meetings. The organisation that can assess weekly "which scenario best describes the current situation" and execute pre-designed responses is the one that will secure competitive advantage in the chokepoint era.
References and Key Sources
- UNCTAD. (2026). Hormuz shipping disruptions raise risks for energy, fertilizers and vulnerable economies.
- IEA. (2026). Update on IEA collective action decision of 11 March 2026.
- Lloyd's Market Association, Joint War Committee. (2026). JWLA-033: Iran – Listed Areas Update.
- Reuters. (2026-03-02). Middle East oil shipping costs surge to all-time high as U.S.-Iran conflict intensifies.
- Ministry of Economy, Trade and Industry (METI). (2026-03-16). Reduction of Private Reserve Obligations and Release of National Strategic Petroleum Reserves.
- Ministry of Economy, Trade and Industry (METI). (2026-03-24). Release of National Strategic Petroleum Reserves (Approx. 8.5 million kL).
- Japan Petrochemical Industry Association. (2026-03-17). Comment on Impact of Iran Conflict on Naphtha Supply.
- Japanese Shipowners' Association. (2026-03). Request for Support in Facilitating Early Departure of Crew and Vessels Stranded in the Persian Gulf.
- Agency for Natural Resources and Energy. (2026-03-25). Petroleum Reserve Status (Preliminary Estimates): Total 238 Days.
- Economist Online (Mainichi). (2025). The World's Chokepoints Go Beyond the Panama Canal.
- IMO. (2026). IMO calls for safe passage framework in Strait of Hormuz.
- Schoemaker, P. J., Day, G. S., & Snyder, S. A. (2013). Integrating organizational networks, weak signals, strategic radars and scenario planning. Technological Forecasting & Social Change, 80(4), pp.815-824.
- Oxford Economics. (2026-03). Hormuz disruption: price and transit recovery outlook.
- Marubeni Research Institute. (2026-03-24). The Hormuz Crisis and Its Impact on Global Supply Chains.
- BIMCO. (2026-03). War Risks in the Strait of Hormuz: Charter Party Guidance.
- Bloomberg. (2026-03-11). Iran war drives key Japanese aluminum fee to highest since 2015.
The information in this article is current as of the end of March 2026. For the latest developments, please refer to official announcements from relevant government ministries and international organisations.